Using TradingView to Develop Your Bot Strategies
Implement TradingView strategy logic directly into your Trading Scripts.
Posted by

Introduction
TradingView is one of the most versatile tools available for traders, offering advanced charting, indicators, and data analysis capabilities. Whether you' re refining a strategy or testing its effectiveness, TradingView provides an intuitive platform to enhance your trading bot logic before automating it with the Bot Brie Boilerplate.
Here are five top ways to use TradingView to develop and perfect your algorithmic trading strategies:
1. Convert OHLC Bars to Heiken Ashi for Smoother Trends
Heiken Ashi bars are excellent for reducing noise and identifying clear trends. Converting standard OHLC (Open, High, Low, Close) bars to Heiken Ashi can help you spot color crossovers and trend reversals more effectively.
How to Use It:
- On TradingView, switch your chart type to Heiken Ashi.
- Observe where green (bullish) bars turn red (bearish) or vice versa—these are potential trend shifts.
- Fine-tune your entry/exit points based on these crossovers.

2. Experiment with Indicator Timeframe Settings
Trading indicators like MACD, Stochastic Oscillator, and RSI often require optimal configurations to fit your strategy. TradingView allows you to test these settings visually on different timeframes.
How to Use It:
- Add the desired indicator (e.g., MACD) to your chart.
- Adjust parameters like the fast/slow EMA periods or the RSI lookback window to find the best values for identifying overbought or oversold conditions.
- Observe how changes affect signal frequency and reliability.
3. Identify Confluences of Crossover Signals
Successful strategies often rely on multiple indicators confirming each other (confluence). For example, combining a MACD crossover with a Stochastic crossover adds confidence to a buy signal.
How to Use It:
- Overlay multiple indicators (e.g., MACD and Stochastic) on your TradingView chart.
- Identify points where two or more indicators give the same signal (e.g., MACD bullish crossover + Stochastic bullish crossover).
- Note the frequency and accuracy of these confluences.

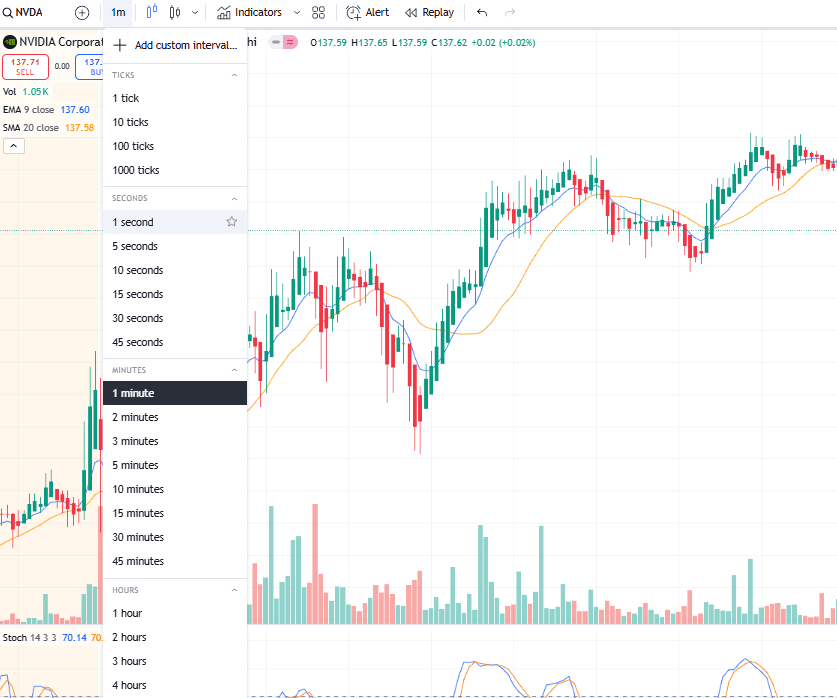
4. Test Different Timeframes for Strategy Effectiveness
The choice of timeframe significantly impacts the effectiveness of a strategy. Intraday traders might prefer 1-minute or 5-minute bars, while swing traders use daily bars. TradingView makes it easy to test your strategy across various timeframes.
How to Use It:
- Switch between timeframes (e.g., 1-minute, 5-minute, daily) on the same asset.
- Observe how indicator signals behave on each timeframe.
- Determine which timeframe aligns with your trading goals and risk tolerance.

5. Pinescript for Custom Indicators and Strategies
Pine Script is TradingView's proprietary scripting language that lets traders create and share custom indicators, signals, or automated strategies. Find a pinescript strategy you like? Code it directly into your trading script with the Bot Brie Boilerplate.
How to use it:
- Create a strategy on pinescript.
- Implement code logic to Bot Brie for Paper or Live Trading via Alpaca API.
// Simple Moving Average Crossover Strategy
// ————————————————
//@version=5
strategy("Basic SMA Crossover Strategy", overlay=true)

// ——— INPUTS ———
shortLength = input.int(9, title="Short MA Length")
longLength  = input.int(21, title="Long MA Length")

// ——— CALCULATIONS ———
// Calculate short and long SMAs
smaShort = ta.sma(close, shortLength)
smaLong  = ta.sma(close, longLength)

// ——— CONDITIONS ———
longCondition  = ta.crossover(smaShort, smaLong)
shortCondition = ta.crossunder(smaShort, smaLong)

// ——— TRADING LOGIC ———
if longCondition
    strategy.entry("Long", strategy.long)

if shortCondition
    strategy.entry("Short", strategy.short)

// Example of adding a fixed stop-loss and take-profit (in pips/points)
stopLossPct = input.float(2.0, title="Stop Loss %", tooltip="Stop loss as a percentage")
takeProfitPct = input.float(4.0, title="Take Profit %", tooltip="Take profit as a percentage")

// Place the exit conditions right after the strategy entries
if strategy.position_size > 0
    strategy.exit("Exit Long", "Long",
       stop_loss = strategy.position_avg_price * (1 - stopLossPct/100),
       limit     = strategy.position_avg_price * (1 + takeProfitPct/100))

if strategy.position_size < 0
    strategy.exit("Exit Short", "Short",
       stop_loss = strategy.position_avg_price * (1 + stopLossPct/100),
       limit     = strategy.position_avg_price * (1 - takeProfitPct/100))
Conclusion
TradingView is an indispensable tool for refining your algorithmic trading strategies. By converting OHLC bars to Heiken Ashi, experimenting with indicator settings, identifying confluences, testing timeframes, and using alerts, you can develop robust strategies ready for automation. Paired with the Bot Brie Boilerplate, these insights translate into streamlined, profitable trading bots.
Start enhancing your strategies today with TradingView and automate them tomorrow with the Bot Brie Boilerplate!